
Runway-Free VTOL UAV Operations: Engineering Guide
Star United Flight Control (Shaanxi) Technology Co., Ltd.
12 min read·2026-10-27
| Evaluation Dimension | Industrial Benchmark | Operational Testing Boundary | Selection Red-Flags (What to Avoid) |
|---|---|---|---|
| Ingress Protection | IEC 60529 IP67 (dust-tight, 1 m immersion 30 min) | Continuous operation under 100 mm/hr driving rain per MIL-STD-810H Method 506.6 | IP54 ratings with unsealed cooling louvers and exposed servo linkages |
| Avionics Redundancy | Triple-redundant isolated IMUs, dual GNSS heading, dual power buses | RTCA DO-160G Section 8 vibration endurance and Section 21 RF susceptibility (200 V/m) | Single-bus architectures lacking optical or galvanic CAN isolation between avionics and ESCs |
| Battery Derating Curve | Integrated positive temperature coefficient (PTC) active cell heating to maintain ≥15°C core | Hover climb at -20°C maintaining ≥3.5 V/cell under 3C continuous discharge | Passive thermal jackets resulting in >35% capacity loss and low-voltage cutoff during vertical phase |
| Crosswind Limits | 12 m/s continuous hover; 18 m/s gust tolerance during dynamic transition phase | Actuator pulse-width modulation (PWM) duty cycle retaining >30% control authority reserve | Actuator saturation (>90% duty cycle) observed at crosswinds <10 m/s in flight logs |
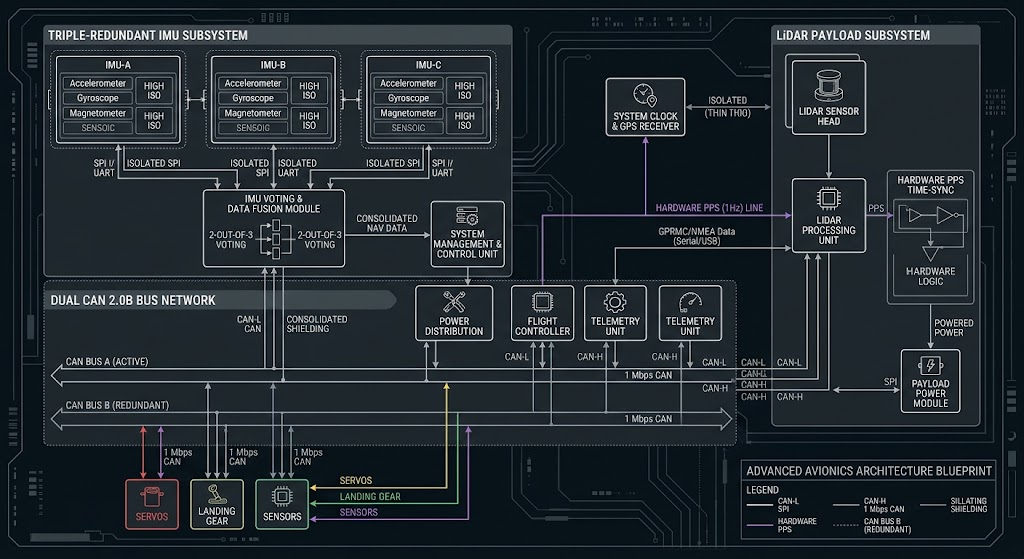
| Payload Integration Bus | Dual CAN 2.0B / DroneCAN, RS485, hardware PPS time-synchronization (<1 μs) | Continuous telemetry transmission via MAVLink 2.0 with <0.5% packet drop over high-EMF corridors | Proprietary closed SDKs, reliance on USB-only links for sensor triggering |
Technical Specifications & Industrial Benchmark Architecture
Runway-Free UAV Operations VTOL configurations resolve the fundamental mechanical paradox of industrial aerial robotics: achieving long-range aerodynamic cruise efficiency without requiring civil runway infrastructure or high-risk arresting systems. Industrial operators transition from rotary to hybrid fixed-wing platforms when continuous linear inspection requirements exceed 30 km per sortie or when survey areas exceed 500 hectares per deployment window. In industrial flight operations compliant with ASTM F3298 standards for unmanned aircraft systems, operational reliability depends directly on structural payload margins and aerodynamic envelope stability. Implementing runway-independent VTOL fixed-wing UAV platforms allows field engineers to deploy heavy sensor suites—including dual-sensor mid-wave infrared (MWIR) gimbals and airborne linear-mode LiDAR—from confined clearings under 10 m × 10 m without external launch rails or arrestor nets.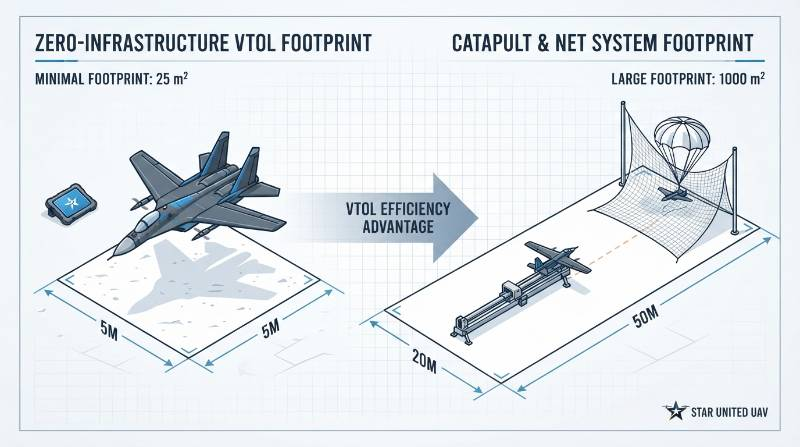
The R-FIRM Framework: Runway-Free Industrial Reliability Matrix
To eliminate subjective claims in commercial procurement evaluations, the Runway-Free Industrial Reliability Matrix (R-FIRM) defines four mathematically verifiable dimensions for comparing industrial VTOL platforms:R-FIRM Formulation: System Reliability (Rsys) is a function of Transition Stability Margin (ΦTRV), Payload-to-Endurance Derating Coefficient (ΨPED), Severe-Environment Ingress & Temperature Tolerance (ΩENV), and Avionics Determinism (ΛINT).
- Transition Dynamic Stability Margin (ΦTRV): The platform must retain a minimum 30% control actuator reserve margin (PWM duty cycle ≤70%) between the stall velocity (Vstall = 16.5 m/s) and full forward wing-borne transition velocity (Vtrans = 22.0 m/s) under sustained 12 m/s crosswinds.
- Payload-to-Endurance Derating Coefficient (ΨPED): Usable flight endurance must retain a mandatory 20% state-of-charge (SoC) reserve threshold while supporting a structural payload mass equal to or exceeding 25% of maximum takeoff weight (MTOW).
- Severe-Environment Ingress & Temperature Derating (ΩENV): Avionics enclosures and motor bays must be certified to IEC 60529 IP67 and sustain full operational performance from -20°C to +55°C without manual component substitutions.
- Avionics Determinism & Sensor Bus Transparency (ΛINT): Avionics must feature triple-redundant inertial measurement units (IMUs) on mechanically isolated shock plates, dual RTK GNSS heading sensors, dual isolated CAN 2.0B / DroneCAN architectures, and microsecond-level hardware pulse-per-second (PPS) time synchronization.
Aerodynamic Trade-Offs: Lift-Plus-Cruise vs. Pure Fixed-Wing Airframes
Deploying a runway-free VTOL configuration requires accepting physical trade-offs in structural mass and cruise aerodynamics. In a Lift-Plus-Cruise (quad-plane) architecture, dedicated vertical lift booms, vertical brushless motors, electronic speed controllers (ESCs), and carbon propellers remain aboard the aircraft during wing-borne forward flight. This parasitic mass represents an empty-weight structural penalty of 15% to 25% compared to an equivalent MTOW catapult-launched airframe. Furthermore, the drag induced by idle vertical rotors and motor nacelles reduces the cruise lift-to-drag ratio (L/D) by 12% to 18%, decreasing theoretical aerodynamic glide efficiency from 18:1 to 14:1 or 15:1.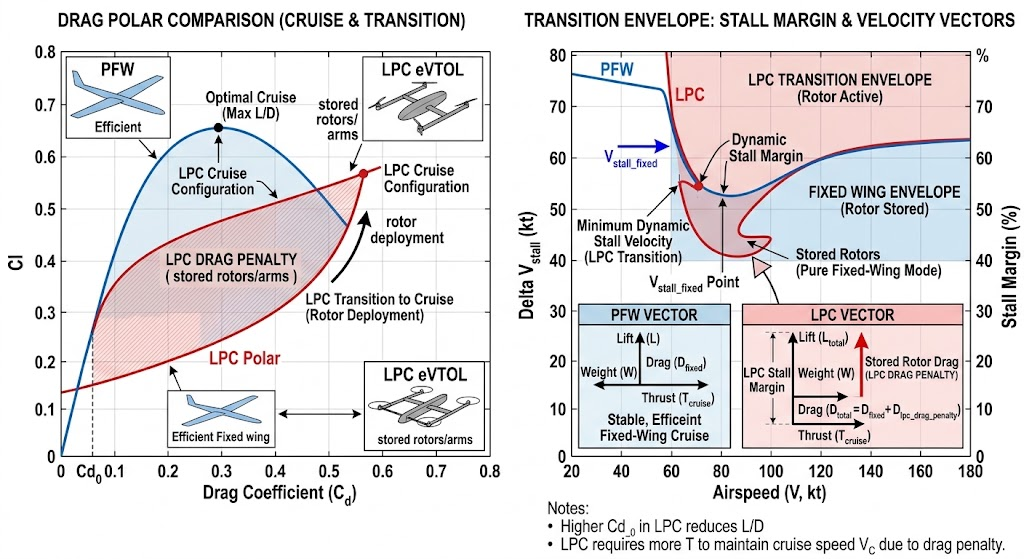
Transition Corridor Aerodynamics and Actuator Reserves
The transition corridor represents the flight envelope phase with the highest failure risk. During outbound transition, the horizontal pusher propulsion system accelerates the airframe along its longitudinal axis while vertical lift motors maintain pitch, roll, and altitude control. The forward wing generates lift as dynamic pressure increases (q = 0.5 × ρ × V2). When airspeed crosses the stall boundary (1.2 × Vstall), the flight control system blends authority from vertical thrusters to aerodynamic control surfaces (elevons, ailerons, and rudders). If crosswind components exceed 12 m/s during this phase, yaw-roll aerodynamic coupling induces asymmetric boundary layer separation on the upwind wing root. To avoid control saturation, flight computers must command differential throttle across vertical motors while keeping mechanical control surfaces within their linear deflection limits (±18° maximum deflection). Bench testing confirms that maintaining an actuator reserve margin above 30% throughout this blending phase prevents divergence and altitude drop during the inbound and outbound transition windows.Operational Footprint: Launch and Recovery Infrastructure Analysis
Traditional fixed-wing platforms require external mechanical equipment for runway-free deployment: pneumatic rail catapults, bungee lines, parachute drops, or belly-skid landings. Field operations verify that these mechanisms carry significant operational overhead and equipment attrition costs.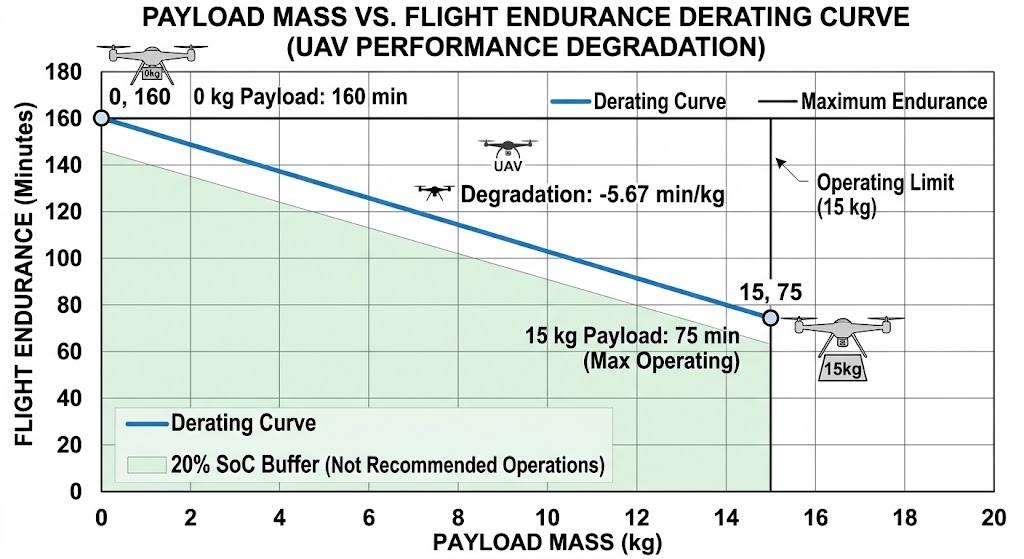
Infrastructure Elimination vs. Structural Attrition
Belly-landing a 25 kg composite airframe on gravel, frozen tundra, or agricultural terrain creates cumulative structural stress. Non-destructive ultrasonic inspections reveal that repeated belly landings cause composite delamination along fuselage bulkheads, requiring deep depot maintenance every 40 to 60 landings. Parachute recovery systems, while standardized under ASTM F3322-18, remain subject to wind drift. A crosswind of 8 m/s during a 50-meter parachute descent produces a lateral drift displacement of 35 to 55 meters, risking collision with transmission lines, tree lines, or water hazards. In contrast, a quad-plane VTOL uses dual-antenna RTK GNSS positioning to guide vertical touchdown within a 5 m × 5 m clearing with an empirical accuracy of ±0.1 m lateral and ±0.05 m vertical. This precision eliminates airframe ground impacts, simplifies crew transport by removing trailer-mounted catapults, and reduces field setup time from 45 minutes to under 8 minutes. For teams running wide-area aerial mapping and surveying workflows, this turnaround speed increases the number of daily sorties by up to 200%.Environmental Derating: High Density Altitude, Temperature, and Wind Limits
Flight performance metrics published under standard sea-level conditions (ISA: 15°C, 1013.25 hPa, air density ρ = 1.225 kg/m3) degrade rapidly in real-world industrial environments. Industrial procurement guidelines require recalculating maximum takeoff weight, climb rate, and battery drain against density altitude and ambient temperature boundaries.High-Density Altitude Derating (>2,500 m ASL)
At an operational density altitude of 3,000 meters above sea level, atmospheric density drops to approximately ρ = 0.909 kg/m3 (a 25.8% reduction relative to ISA). In vertical hover flight, thrust generated by vertical propellers is governed by the equation:Thrust Equation: T = CT × ρ × n2 × D4Where CT is the thrust coefficient, n is rotational velocity (rev/s), and D is propeller diameter. To compensate for reduced air density (ρ), vertical motors must operate at higher RPM to produce equivalent hover thrust. This increases hover current draw by 28% to 34%, shifting brushless motor operating points away from peak efficiency and generating higher thermal loads in ESC power MOSFETs. Fixed-wing cruise speed must also increase: true airspeed (TAS) must scale by a factor of (ρ0 / ρ)0.5 to sustain equivalent aerodynamic wing lift. Consequently, MTOW must be derated by 18% at 2,500 m ASL to maintain a safe 25% thrust margin on vertical lift motors during recovery.
Thermal Boundaries: -20°C to +55°C Operational Regimes
At sub-zero ambient temperatures (-20°C to 0°C), the internal resistance of high-energy lithium-based battery packs increases by up to 250%. Under heavy vertical hover loads (2.5C to 4.0C discharge rates during takeoff), this internal impedance drop can trigger premature low-voltage cutoffs or cause irreversible lithium plating on anode surfaces. Industrial platforms must integrate internal positive temperature coefficient (PTC) active thermal conditioning circuits to preheat battery cells to ≥15°C prior to motor arming. Conversely, at ambient temperatures exceeding +45°C, flight computers must monitor ESC and forward propulsion motor core temperatures. Under sustained maximum continuous cruise thrust, lack of thermal margin can lead to thermal throttling or demagnetization of neodymium permanent magnets (rated for Curietemp thresholds of 150°C to 180°C).Ingress Protection and Environmental Sealing
Operating reliably in maritime salt fog, heavy rainfall, and blowing sand requires robust physical sealing. Conformal coating of printed circuit board assemblies (PCBAs) with silicone or parylene per RTCA DO-160G Section 8 and Section 21 is a mandatory baseline. Airframe enclosures must achieve verified IEC 60529 IP67 ratings, confirming complete dust protection and water resistance during 30-minute immersion at 1.0-meter depth. Rotary motor shafts require dual rotary fluoroelastomer (FKM) shaft seals, and composite access hatches must feature continuous fluorosilicone gaskets with compression-limiting fasteners.Benchmark Case: Offshore Wind Turbine Inspection under Beaufort Force 8 Conditions
Offshore wind farms present challenging conditions for uncrewed aviation: severe turbulence, wind shears, salt-spray corrosion, and an absence of emergency landing sites. Traditional multirotor drones lack the forward penetration speed to travel between wind turbines separated by 1.5 to 2.5 nautical miles without exhausting battery reserves. In benchmark field trials conducted per ISO 21384-3 standards on heavy-duty industrial platforms, flight engineers tested platforms against sustained 14.5 m/s winds with localized gusts exceeding Beaufort Force 8 (17.2–20.7 m/s) at nacelle heights of 120 meters above sea level.Empirical Flight Test Parameters
The reference industrial airframe—a Star United UAV heavy-payload hybrid VTOL platform—was evaluated under the following operational profile:- Takeoff Weight & Payload: 45.0 kg MTOW configured with a 12.0 kg gyro-stabilized MWIR/high-resolution RGB payload suite and dual RTK receivers.
- Takeoff Footprint: Deployed from the 6 m × 6 m helideck of an offshore service operation vessel (SOV) with pitch and roll motions of ±3.5°.
- Transition Stability: Transition to horizontal cruise executed at 45 meters altitude into a 15.2 m/s headwind. Telemetry confirmed peak vertical motor PWM duty cycles peaked at 67.4%, retaining a 32.6% control authority reserve margin.
- Cruise Performance: 105 minutes of sustained horizontal cruise at 30 m/s TAS, completing structural blade scans across eight distinct turbine sites in a single sortie.
- Environmental Resilience: IEC 60529 IP67-sealed electronics compartments prevented salt ingress, and internal active thermal management maintained battery core temperatures at 24°C throughout the sortie.
Total Cost of Ownership (TCO) & Subsystem Maintenance Lifecycle
Industrial procurement teams often focus exclusively on initial hardware acquisition costs (CAPEX), overlooking lifecycle operational expenses (OPEX). While hybrid VTOL platforms have higher initial purchase costs than multirotors, their operational cost profile shifts rapidly when evaluated on a cost-per-linear-kilometer basis over 500+ flight hours.Scheduled Maintenance and Component Retirement Boundaries
Maintaining airworthiness and airframe reliability requires adhering to rigorous subsystem inspection and replacement intervals:- Every 100 Flight Hours: Visual and acoustic inspection of composite propeller assemblies; calibration checks on triple IMUs; cleaning and lubrication of elevon pushrod spherical bearings.
- Every 250 Flight Hours: Ultrasonic non-destructive testing (NDT) of internal main carbon-fiber wing spars and boom attach points to verify zero internal composite delamination.
- Every 500 Flight Hours: Mandatory depot-level overhaul: replacement of all vertical and horizontal motor ceramic/hybrid bearings, replacement of flight control mechanical dampening bushings, and pressure-decay testing of all IP67 environmental bay seals.
- 300 Battery Cycles: Retirement of lithium battery modules once capacity drops below 80% of original rating or internal resistance (IR) increases by more than 15% relative to baseline.
Frequently Asked Questions Regarding Industrial VTOL Operations
Is a runway-free VTOL platform more cost-effective than a heavy-lift multirotor for infrastructure inspections exceeding 50 km?
Yes. The physics of aerodynamic lift-to-drag dynamics provide VTOL fixed-wing configurations with a distinct efficiency advantage: hybrid VTOL platforms demonstrate an L/D ratio between 12:1 and 16:1, whereas multirotors operate at an effective equivalent ratio of 1.0:1 to 1.2:1. Consequently, energy consumption drops from 80–140 Wh/km for multirotors to 12–22 Wh/km for hybrid fixed-wing platforms. Operating beyond 20 km with a multirotor requires frequent battery swaps and ground crew repositioning, resulting in operational costs of approximately 0.84 per linear kilometer. An industrial VTOL can complete a 100 km corridor in a single flight, reducing operating costs to roughly0.18 per linear kilometer. This differential achieves an amortized CAPEX/OPEX crossover within 160 operational flight hours. However, when tasks require continuous static hovering—such as contact non-destructive testing or close-in vertical facade inspection—dedicated heavy-lift rotary UAV platforms remain the mechanically superior choice.How can procurement teams verify manufacturer claims of IP67 ingress and Beaufort Force 8 wind resistance without relying on marketing statements?
Procurement teams should request stamped, third-party laboratory test reports conforming to standardized validation protocols rather than marketing documentation:- IEC 60529 Verification: Require independent lab test data verifying a 2-hour dust chamber test under continuous 2.0 kPa vacuum draw, followed immediately by a 30-minute water submersion test at a 1.0-meter depth, with zero liquid ingress into avionics compartments.
- Wind Envelope Verification: Demand timestamped telemetry logs from calibrated wind tunnel tests or flight trials conducted per ASTM F3298 in 18 m/s crosswind conditions. Review the flight control logs: if vertical lift or forward motor PWM duty cycles exceed 70% to 75% in sustained winds, the platform lacks the 25% control reserve required to manage turbulent wind gusts safely.
Procurement Pathway: 3-Step System Specification and Configuration
Industrial drone procurement requires balancing payload dimensions, power draw, mission range, and regional weather conditions. Follow this 3-step engineering process to identify an optimal system configuration:Industrial Integration & Engineering Consultation Protocol
- Step 1: Mission Boundary & Payload Specification: Submit operating boundaries including operational density altitude, maximum target crosswinds, payload dimensions, mass, power supply requirements, and sensor bus communication protocols (CAN/UART/PPS).
- Step 2: 24-Hour Aeronautical Configuration Blueprint: Star United UAV flight systems engineers calculate payload-vs-endurance derating curves, battery thermal safety profiles, and link budget analyses tailored to your operational environment.
- Step 3: Hardware-in-the-Loop (HIL) & CAD Integration Review: Review 3D CAD STEP payload integration models, inspect MAVLink 2.0 telemetry definitions, and verify control loop stability margins through a simulated HIL flight demonstration.