
VTOL Fixed-Wing UAV Flight Endurance: Complete Guide
Star United Flight Control (Shaanxi) Technology Co., Ltd.
9 min read·2026-09-29
Understanding VTOL Fixed-Wing UAV Flight Endurance: Core Dynamics & Benchmarks
A commercial VTOL fixed-wing UAV stays airborne anywhere from 60 minutes to over 10 hours depending on its propulsion architecture, structural aerodynamics, and operational payload. Pure battery-electric systems average 90 to 150 minutes, whereas gas-electric hybrid platforms exceed 6 to 10 hours under nominal flight profiles. Vertical Take-Off and Landing (VTOL) systems combine the zero-infrastructure launch capabilities of multi-rotors with the high lift-to-drag (L/D) ratios of traditional fixed-wing aircraft. Once airborne, aerodynamic lift generated by the aerofoil supports the platform's maximum takeoff weight (MTOW), reducing power consumption by up to 75% compared to hovering rotary craft.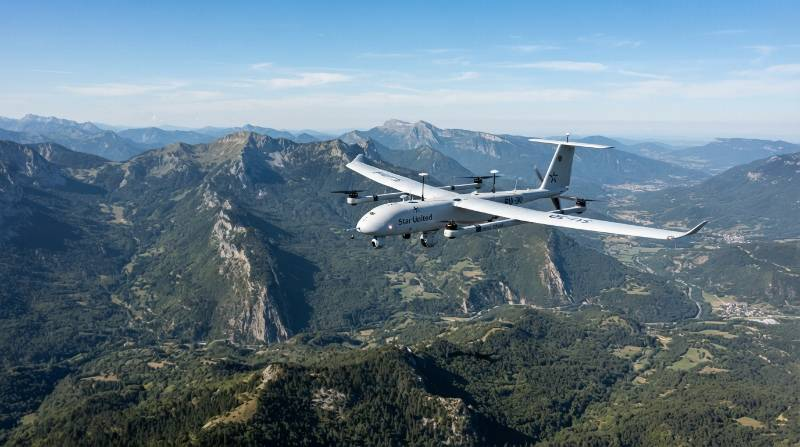
Statistical Density Benchmark: Fixed-wing wing-borne flight requires approximately 45–65 W/kg of aircraft weight during level cruise at optimal airspeed, compared to 160–220 W/kg for hover in multi-rotor flight modes under standard atmosphere conditions (ISA, sea level, 15°C).
Airframe Architectures and Aerodynamic Cruise Efficiency
The structural layout of a VTOL platform dictates its parasite drag coefficient ($C_{Dp}$) and structural weight overhead, establishing the upper limit for flight endurance.Lift + Cruise (QuadPlane Configuration)
This layout utilizes dedicated horizontal lift booms with vertical thrust motors for takeoff and landing, paired with an isolated pusher or tractor motor for forward propulsion. While it offers mechanical simplicity, the stationary vertical motor arms and exposed rotors generate significant parasite drag during cruise, reducing total potential flight time by 12% to 18% compared to clean airfoils.Tilt-Rotor and Tilt-Wing Systems
Tilt-rotor systems rotate propulsion pods from a vertical orientation during hover to a horizontal axis for forward flight. By utilizing the same motors for both phases, they eliminate deadweight and drag from stationary booms. However, the mechanical tilt mechanisms, servos, and structural reinforcements add dry mass, demanding a higher continuous power draw.Tail-Sitter Architectures
Tail-sitters launch vertically resting on their empennage and pitch down 90 degrees into forward flight. This provides the most aerodynamically efficient airframe with zero parasitic propulsion gear. The trade-off is extreme sensitivity to ground crosswinds during landing and complex aerodynamic transition control loops.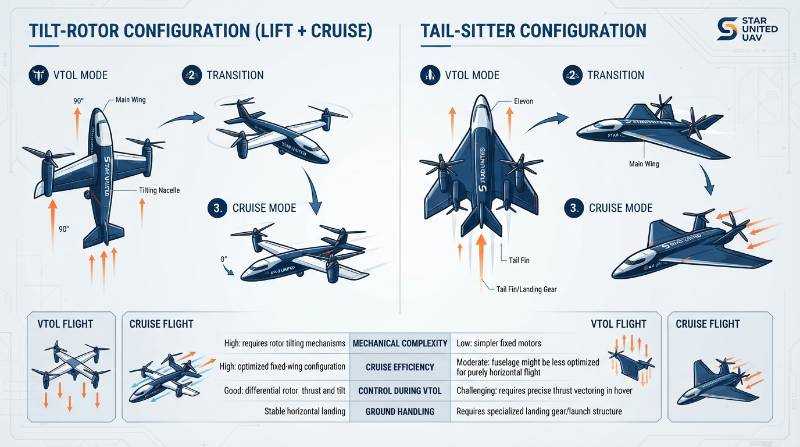
| Architecture | Parasitic Drag | Mechanical Complexity | Wind Rejection (Hover) | Endurance Penalty |
|---|---|---|---|---|
| Lift + Cruise | High | Low | Up to Level 6 (12 m/s) | 15% reduction in cruise |
| Tilt-Rotor | Low | High | Up to Level 5 (10 m/s) | 5% (added servo weight) |
| Tail-Sitter | Minimal | Moderate | Up to Level 4 (7 m/s) | 0% (optimal cruise profile) |
Propulsion Technology Comparison: Electric, Hybrid EFI, and Hydrogen Cells
Power source selection dictates system gravimetric energy density ($Wh/kg$), the primary factor in airborne endurance calculations.Lithium-Polymer (LiPo) vs. Lithium Solid-State
Standard enterprise LiPo and High-Voltage Li-ion packs yield energy densities ranging between 180 and 240 Wh/kg. Solid-state lithium battery packs deliver 300 to 400 Wh/kg by swapping volatile liquid electrolytes for high-stability ceramic/polymer matrices. This allows pure-electric VTOL platforms to scale from standard 90-minute missions up to 180-minute windows without increasing the airframe's maximum takeoff weight.Electronic Fuel Injection (EFI) Gas-Electric Hybrids
Gas-electric hybrid systems utilize a two-stroke or four-stroke internal combustion engine paired with a continuous brushless DC generator. Regular gasoline supplies a chemical energy density of approximately 12,000 Wh/kg. Even when factoring in mechanical and thermal conversion losses (yielding roughly 1,000–1,400 Wh/kg system efficiency), gas-electric hybrid propulsion outperforms pure batteries. These systems routinely achieve continuous flight windows between 4 and 10 hours for demanding corridor operations.Proton-Exchange Membrane (PEM) Hydrogen Fuel Cells
Gaseous hydrogen stored at 350 to 700 bar delivers an effective system density of 500 to 800 Wh/kg. Hydrogen fuel cells generate clean, zero-emission electricity for long-duration flights (3 to 6 hours) with low acoustic and thermal signatures, though they require dedicated field-refueling infrastructure.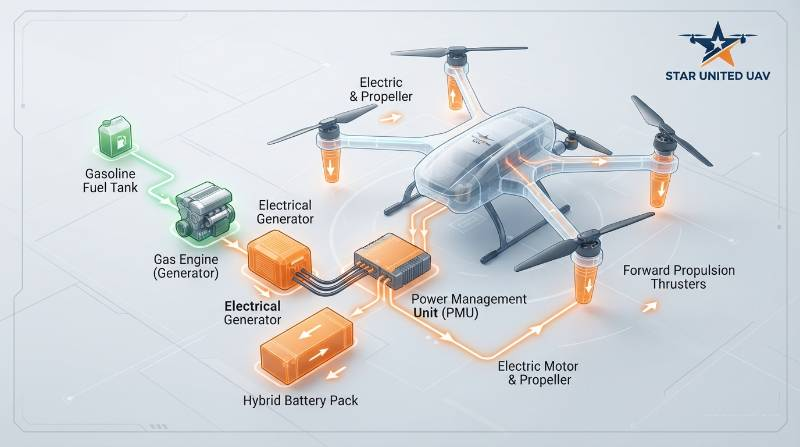
Engineering Benchmark: According to ASTM F3298 standards for unmanned aircraft systems airworthiness, propulsion power margins must guarantee a minimum 20% electrical reserve threshold upon landing under nominal operational profiles.
Dynamic Payload-Endurance Decay Modeling: LiDAR vs. Photogrammetry
Payload mass directly degrades flight time through induced drag. As payload increases, the wing must operate at a higher angle of attack to generate compensating lift, sharply increasing induced drag ($C_{Di} = \frac{C_L^2}{\pi e AR}$). When selecting payload configurations for aerial mapping and surveying drone solutions, operators must account for both deadweight and continuous sensor power consumption.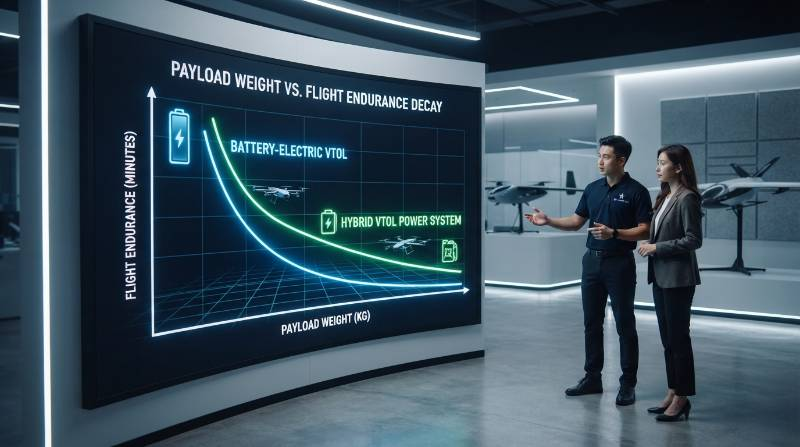
Payload-Power Decay Equation: $T_{flight} = T_{0} \times \left( \frac{MTOW - M_{payload}}{MTOW} \right)^{\alpha} - \left(\frac{P_{sensor}}{P_{total}} \times T_{0}\right)$ Where $T_{0}$ is baseline unladen endurance, $\alpha$ is the induced drag coefficient factor (typically 1.35 to 1.55 on high-aspect-ratio platforms), and $P_{sensor}$ represents the continuous onboard wattage demanded by the sensor.
Sensor Payload Degradation Benchmarks
- Full-Frame RGB Photogrammetry Camera (0.6 kg, 8W draw): Causes an 8% to 12% total reduction in airborne mission endurance.
- Dual-Sensor Electro-Optical/Infrared Gimbal (1.4 kg, 22W draw): Results in a 19% to 26% reduction in operational mission endurance.
- Long-Range Multi-Return LiDAR + IMU (2.8 kg, 45W draw): Produces a 38% to 48% reduction in total airborne window.
Real-World Environmental Factors: Density Altitude, Temperature, and Wind
Theoretical wind-tunnel endurance figures rarely match field operations due to atmospheric and environmental variables.Density Altitude ($H_d$) Effects
High temperatures, low atmospheric pressures, and high operational elevations reduce air density ($\rho$). In low-density air, the wing must travel at a higher true airspeed (TAS) to generate the equivalent dynamic pressure ($q = \frac{1}{2}\rho V^2$) needed for level flight. This forces the propulsion system to run at elevated throttle settings, increasing continuous amp draw by 15% to 25% at density altitudes above 2,500 meters.Sub-Zero Temperatures (-20°C to 0°C)
Electrochemical reaction speeds drop significantly in freezing environments, increasing internal cell resistance ($R_i$) within lithium batteries. This causes severe voltage sag under load, reducing effective discharge capacity by 20% to 35% unless pre-heated battery enclosures and active thermal jackets are deployed.Wind Resistance and Groundspeed Deficits
While a VTOL may cruise at an indicated airspeed (IAS) of 22 m/s, flying into a continuous 10 m/s headwind reduces groundspeed to 12 m/s. This doubles the time and energy required to survey a linear corridor. For critical infrastructure monitoring using long-range industrial inspection solutions, flight planners must calibrate ground coverage rates against ambient wind vectors rather than relying on airframe airspeed metrics alone.The Transition Phase Energy Tax: Hover Power vs. Level Wing-Borne Flight
The transition corridor is the most power-intensive segment of any VTOL flight profile. During this phase, vertical lift motors operate at peak electrical draw while the horizontal thruster accelerates the airframe to its stall-out speed margin ($V_{stall} \times 1.2$).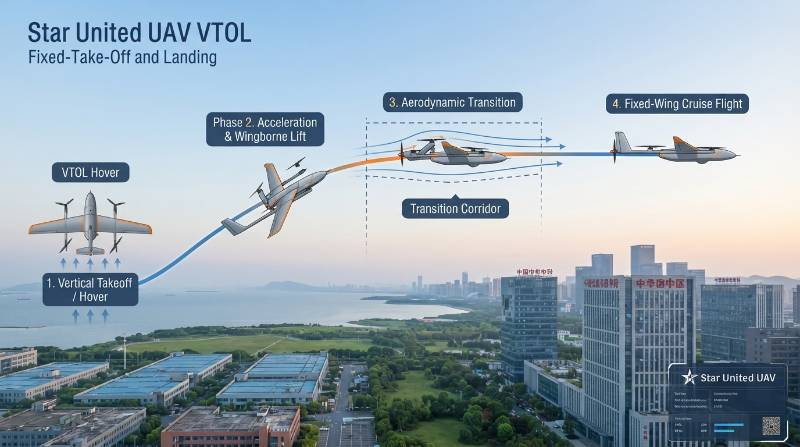
Avionics Insight: Transition protocols governed by the ISO 21384-3 standard prioritize rapid wing-lift generation over sustained hover climb to minimize high-amp battery strain.
The Mission Range Optimization Framework (MROF)
To systematically maximize flight envelopes across demanding mission profiles, Star United UAV engineers deploy the proprietary four-stage Mission Range Optimization Framework (MROF).1. Payload Envelope Dynamic Calibration
Match the sensor mass to the precise minimum operational resolution (GSD) required. Eliminating excess payload mass saves battery capacity for endurance rather than hauling unnecessary sensor housing.2. Density Altitude Offset Factoring
Calculate daily atmospheric density using airfield altimeter settings and ambient surface temperatures. Adjust cruise velocity targets upward to maintain peak wing L/D efficiency across thin air profiles.3. Hybrid EFI Energy Distribution Strategy
For hybrid powertrains, program avionics to draw electrical hover power from high-discharge buffer batteries while the EFI combustion unit runs at peak BSFC (Brake Specific Fuel Consumption) efficiency to charge the bus during cruise.4. Wind-Aware Energy Trajectory Routing
Plan survey legs cross-wind or down-wind during outbound long-distance corridors, saving headwind legs for lower-mass conditions near the home base to preserve reserve margins.Enterprise Operational Coverage: Linear Corridor vs. Area Mapping Benchmarks
Flight endurance translates directly into field productivity, surface coverage, and reduced operational costs. For applications such as border surveillance, oil and gas line inspection, and asset security using perimeter security and patrol drones, endurance dictates whether a site requires multiple launch stations or a single autonomous hub.| Metric | Standard Multi-Rotor | Electric VTOL (LiPo) | Solid-State Electric VTOL | Gas-Electric Hybrid VTOL |
|---|---|---|---|---|
| Flight Duration | 35–45 min | 90–120 min | 150–180 min | 360–600 min |
| Linear Corridor Coverage | 15–20 km | 80–110 km | 140–180 km | 350–550 km |
| Area Mapping @ 3cm GSD | 1.5 sq km | 8–12 sq km | 15–20 sq km | 40–60 sq km |
| Sorties per 100km Corridor | 5–6 flights | 1–2 flights | 1 flight | 1 flight (continuous) |