
VTOL UAV Payload Capacity Trade-Offs & Avionics
Star United Flight Control (Shaanxi) Technology Co., Ltd.
10 min read·2026-10-23
| Evaluation Dimension | Industrial Benchmark | Operational Testing Boundary | Selection Red-Flags (What to Avoid) |
|---|---|---|---|
| Energy Bus Stability | Dual-bus hybrid buffer (50.4 V nominal, ≤1.8 V drop during 30C conversion pulse) | Continuous hover-to-cruise transition at MTOW, -10°C ambient, 45 s duration | Single-bus architectures without supercapacitor/solid-state transient surge protection |
| Aerodynamic Derating (ΔCDp) | Conformal bay integration: ΔCDp ≤ 0.004; Lift-to-Drag ratio (L/D) ≥ 14.5 | Tunnel calibration per ISO 21384-3 at 32 m/s cruise velocity under full sensor load | Blunt chin-mount external gimbals inducing flow separation and boundary layer stall |
| Avionics Redundancy & Bus | Triple-redundant CAN-FD bus; Hardware PPS time-stamping accuracy <10 ns | RTCA DO-160G Section 21 (RF susceptibility Cat R) & Section 8 (Vibration Cat U2) | Non-deterministic shared I2C sensor buses; lack of physical hardware voting logic |
| Environmental Ingress & Sealing | IP67 enclosure rating with continuous fluorosilicone gaskets and ePTFE breathers | IEC 60529 submersion (1.0 m for 30 min) and MIL-STD-810H Method 509.7 Salt Fog | Adhesive foam tape gaskets; passive vent designs allowing vapor-phase condensation |
| Hover Transition Wind Envelope | 15.0 m/s sustained crosswind (Beaufort 7-8); gust survival to 18.5 m/s | ASTM F3298-19 dynamic stability testing with control margin saturation ≤75% | Unrated roll-authority margins where rotor vector saturation exceeds 85% at >10 m/s wind |
The 4-Tier Operational SWaP-E Decision Framework
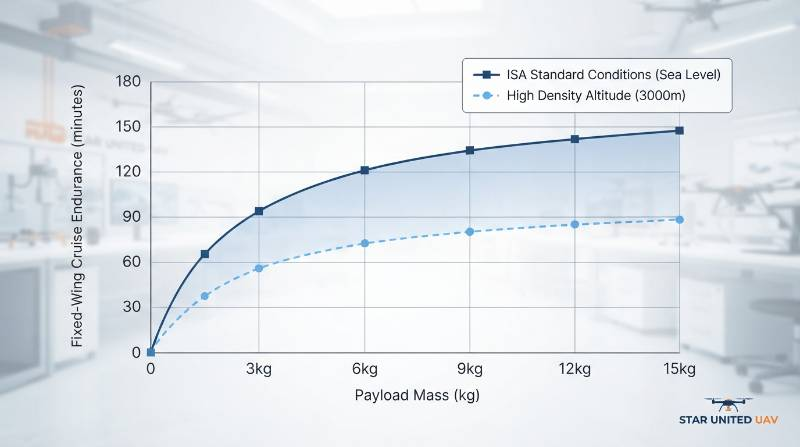
Vertical Take-Off and Landing (VTOL) payload capacity trade-offs represent an interconnected physical balance between transition energy consumption, aerodynamic parasite drag, structural empty-weight fraction, and system operational boundaries. Expanding payload mass directly degrades the maximum rate of climb, diminishes gust tolerance during the aerodynamic transition window, and non-linearly reduces cruise endurance per unit of battery mass. Evaluating industrial VTOL fixed-wing UAV platforms requires measuring how integrated payloads alter aerodynamic polars, electrical distribution stability, and long-term airframe maintenance schedules. To establish baseline trade-off parameters for multi-sensor configurations, flight engineers must implement an objective SWaP-E (Size, Weight, Power, and Envelope) rubric rather than relying on manufacturer-stated maximum capacity:Operational SWaP-E Framework: An empirical engineering methodology calculating net mission viability by balancing Parasitic Deadweight Penalty (PDP), Transient C-Rate Sag Index (TSI), Aero-Payload Drag Coefficient (ΔCDp), and Environmental Density-Thermal Derating (ηEDT).
- Parasitic Deadweight Penalty (PDP): The structural ratio of inactive vertical lift-boom mass, lift motors, and esc assemblies to the total lifting wing area during horizontal cruise flight, expressed in g/m². Benchmark limits require PDP ≤ 210 g/m² to prevent severe glide ratio (L/D) penalties.
- Transient C-Rate Sag Index (TSI): The primary DC bus voltage drop recorded during the 30 s to 45 s hover-to-cruise conversion phase under Maximum Design Takeoff Mass (MDTOM). Safe operational tolerance mandates a voltage drop ≤ 4.5% of nominal rail voltage.
- Aero-Payload Drag Coefficient (ΔCDp): The parasitic drag differential introduced by non-conformal or external pod mountings relative to a clean aerodynamic airframe polar curve. Values exceeding ΔCDp = 0.008 demand immediate aerodynamic fairing redesign to prevent cruise range losses above 20%.
- Environmental Density-Thermal Derating (ηEDT): The empirical degradation factor calculating endurance reduction as a coupled function of density altitude (1.2% loss per 100 m elevation above mean sea level) and thermal extremes (0.8% capacity loss per 1°C ambient drop below 15°C down to -20°C per ASTM F3298-19 parameters).
Transition Dynamics and Electrical Bus Voltage Stability
The aerodynamic transition window between vertical rotor-borne hover and horizontal wing-borne flight presents the highest thermal and electrical stress in VTOL operations. During conversion, both the vertical lift quad-rotor array and the horizontal tractor/pusher propulsion systems operate concurrently for 25 to 45 seconds. This operational overlap draws aggregate current pulses scaling between 15C and 35C relative to nominal pack capacity. In single-bus electrical architectures, this instantaneous current spike causes high internal-resistance (IR) voltage drops across the lithium cell chemistry. If bus voltage falls below the low-voltage cutoff threshold of digital avionics or Electronic Speed Controllers (ESCs), the platform risks localized microprocessor brownouts or premature motor desynchronization. Industrial implementations must isolate critical avionics via isolated DC-DC converters and deploy dual-bus or hybrid-buffered energy distribution topologies.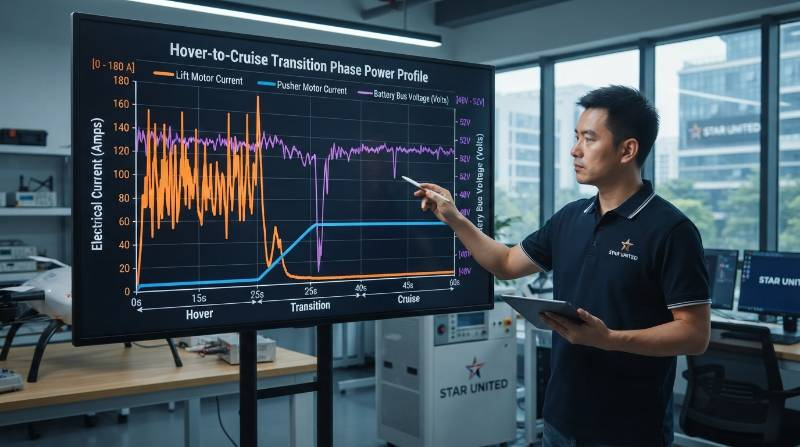
Sensor Integration: Non-Conformal Drag and Vibration Limits
Integrating primary industrial sensors—such as long-wave/mid-wave infrared (EO/IR) dual-sensor gimbals, compact synthetic aperture radar (SAR), or airborne LiDAR scanners—fundamentally compromises airframe aerodynamics if mounted externally. Mounting a standard 250 mm spherical gimbal underneath the nose profile increases total airframe profile drag by ΔCDp = 0.012 to 0.018. This drag increase lowers the cruise Lift-to-Drag (L/D) ratio from an unladen 16.5 down to 11.2, resulting in an unrecoverable 32% reduction in fixed-wing flight radius.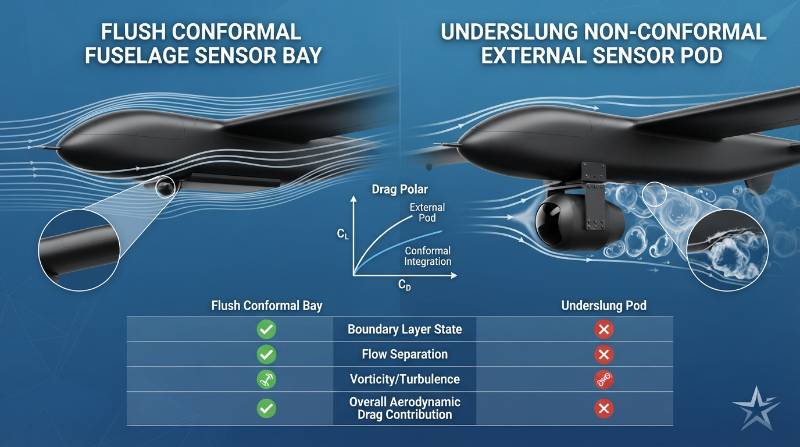
Avionics Bus Compliance, Time-Sync, and Environmental Sealing
Advanced sensor packages demand deterministic, high-bandwidth internal communication networks capable of handling payload telemetry without introducing latency into flight stabilization loops. Traditional single CAN 2.0B or RS485 communication loops lack the bandwidth to transport dense RTK positioning, gimbal telemetry, and flight telemetry concurrently. Avionics specifications must require deterministic CAN-FD (Flexible Data-Rate) architectures operating at 5 Mbps alongside isolated physical RS422 channels.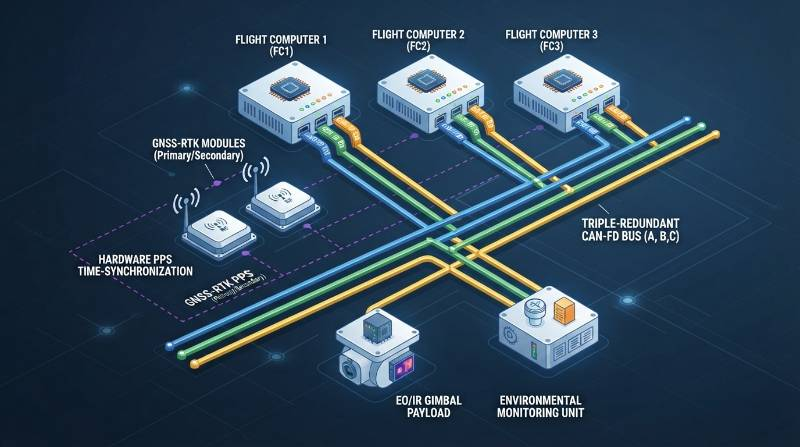
Extreme Mission Benchmark: Offshore High-Wind Corridor Inspection
Linear offshore infrastructure—such as offshore wind farms, export power corridors, and subsea cable landfalls—presents the most demanding operational envelope for VTOL payload integration. In these environments, platforms face sustained maritime boundary-layer winds between 13.5 m/s and 15.0 m/s (Beaufort 7-8), saturated salt-fog atmospheres, and zero ground-level landing alternatives in the event of subsystem failure. During verified benchmark field evaluations conducted on Star United UAV heavy-lift platforms, engineers tested a complex 12.5 kg multi-sensor package consisting of a cooled MWIR thermal camera, a 1,500 m survey-grade LiDAR, and a high-gain C-band tactical communications relay. The operational conditions involved continuous 14 m/s winds, gusts up to 17.5 m/s, and ambient temperatures of -8°C.| Parameter | Clean Baseline (0 kg) | 12.5 kg Payload Array | Observed Variance |
|---|---|---|---|
| Hover Transition Current | 112 A | 198 A | +76.7% Power Spike |
| Fixed-Wing Cruise Velocity | 34 m/s | 29 m/s | -14.7% Operating Speed |
| Usable Safe Endurance (ASTM Reserve) | 148 min | 54 min | -63.5% Flight Duration |
| Gimbal Dynamic Angular Jitter | ±0.008° | ±0.024° | Within 0.03° Spec Limit |
Lifecycle Economics: MTBF, Service Cycles, and TCO Analysis
Procurement teams frequently underestimate long-term Total Cost of Ownership (TCO) by focusing strictly on initial airframe acquisition cost rather than lifecycle maintenance per flight hour. In industrial VTOL operations, system components degrade across distinct operational cycles driven by structural fatigue, thermal stress, and bearing wear. The primary limiting factor in platform operational availability is brushless motor ceramic bearing life. Bench and flight telemetry establish that bearing integrity deteriorates significantly beyond 500 flight hours due to axial loading during transition maneuvers. Platforms lacking modular, quick-disconnect motor pods require complete boom replacements, escalating overhaul costs and driving Mean Time to Repair (MTTR) above 12 hours. Conversely, industrial architectures utilizing modular arm linkages and standardized open CAN-FD bus wiring reduce field MTTR to under 25 minutes. Comparing operational costs against heavy-lift rotary UAV systems over an audited 1,500-flight-hour airframe lifecycle reveals marked structural efficiency differences:- Levelized Maintenance Cost: Industrial VTOL fixed-wing platforms average 18.50 per flight hour (factoring in motor overhauls at 500 hours, servo actuator replacements at 300 hours, and carbon flexural fatigue inspections). Equivalent multi-rotors carrying 10+ kg payloads cost46.20 per flight hour due to continuous 100% rotor duty cycles.
- Airframe Structural Lifespan: Vacuum-infused carbon-epoxy composite airframes demonstrate operational fatigue limits exceeding 2,500 flight hours, provided flight limits do not exceed 3.5G positive and 1.5G negative structural load factors.
- Battery Amortization: High-voltage lithium packs subjected to aggressive 35C conversion spikes without thermal pre-heating degrade to 80% state-of-health (SoH) within 80 cycles. Utilizing automated onboard pre-heaters and dual-bus buffers extends cycle life to 300+ cycles before cell decommissioning.
Procurement Technical Verification and Comparison FAQs
When evaluating long-range linear infrastructure inspection (e.g., a 100 km pipeline corridor), how does a Heavy-Lift VTOL UAV compare to an industrial Multi-Rotor platform in true lifecycle cost per kilometer?
For a 100 km corridor carrying a 10 kg payload, a multi-rotor operates at approximately 10 m/s ground speed. This demands 6 distinct battery sets, 6 leapfrogging ground crew recovery stations, and 5.2 cumulative flight hours, yielding an operational cost of 48.50 per kilometer. An industrial VTOL cruises at 30 m/s, completing the 100 km corridor in a single 1.1-hour flight from a single operations base. Aerodynamic wing-borne lift cuts propulsion energy demand by ~70%, lowering levelized cost to14.20 per kilometer and eliminating ground crew safety exposure.How can an enterprise procurement auditor verify genuine IP67 ingress protection and Beaufort 8 wind stability without relying solely on manufacturer spec sheets?
Auditors must request accredited third-party laboratory test reports documenting compliance with IEC 60529 (continuous immersion at 1.0 m depth for 30 minutes, followed by post-test insulation resistance checks) and physical teardown logs confirming fluorosilicone seals and hydrophobic ePTFE vent valves. To verify Beaufort 8 (15 m/s) wind stability, engineers must audit raw onboard flight controller logs (.bin or .tlog formats). Under sustained 15 m/s crosswind hover, motor control output saturation must remain strictly below 75% (providing a minimum 25% dynamic reserve margin), and sensor gimbal angular jitter must not exceed ±0.03°.What are the primary electrical and mechanical failure modes when operating at the -20°C operational boundary?
Sub-zero operation causes lithium cell electrolyte viscosity to rise, increasing internal impedance and cutting effective capacity by up to 35% without active thermal pre-heating. Mechanically, standard nitrile O-rings reach their glass transition temperature and fail to seal, compromising ingress protection. In unshielded servos, differing thermal contraction rates between metal gears and composite housings cause gear binding. Platforms certified down to -20°C must integrate active battery heating blankets, fluorosilicone elastomeric seals, and avionics rated to industrial temperature ranges (-40°C to +85°C).Three-Stage Technical Integration & Specification Pathway
Integrating heavy multi-sensor payload systems into industrial VTOL platforms requires an empirical, data-driven engineering process. To configure mission-specific hardware that maintains structural safety margins and regulatory compliance, engineers and procurement teams should follow a structured three-stage validation methodology:- Mission Parameters & Environmental Specification Ingestion: Comprehensive collection of operational parameters, including payload mass, continuous/peak bus power draw, operational AMSL elevation, ambient temperature range, required sensor Ground Sample Distance (GSD), and data protocol specifications (CAN-FD, Ethernet, or RS422).
- Tailored UAV Configuration Blueprint Generation: Within 24 hours of specification ingestion, system engineers formulate an empirical payload-vs-endurance derating curve, mass-balance CG envelope calculation, power distribution schematic, and component MTBF projection tailored directly to your environmental profile.
- Senior Avionics Consultation & Flight Test Demonstration: One-on-one technical consultation with senior integration engineers, followed by Hardware-in-the-Loop (HIL) simulation validation and empirical flight testing under stress profiles designed to replicate operational conditions.
Request a Technical Integration Blueprint & Avionics Consultation
Access CAD STEP models, electrical bus schematics, and empirical payload derating curves tailored to your mission requirements. Consult directly with our flight systems integration team to review flight log telemetry, wind tunnel datasets, and structural compliance certifications.
Initiate Technical Payload Assessment